Project Description
Problem
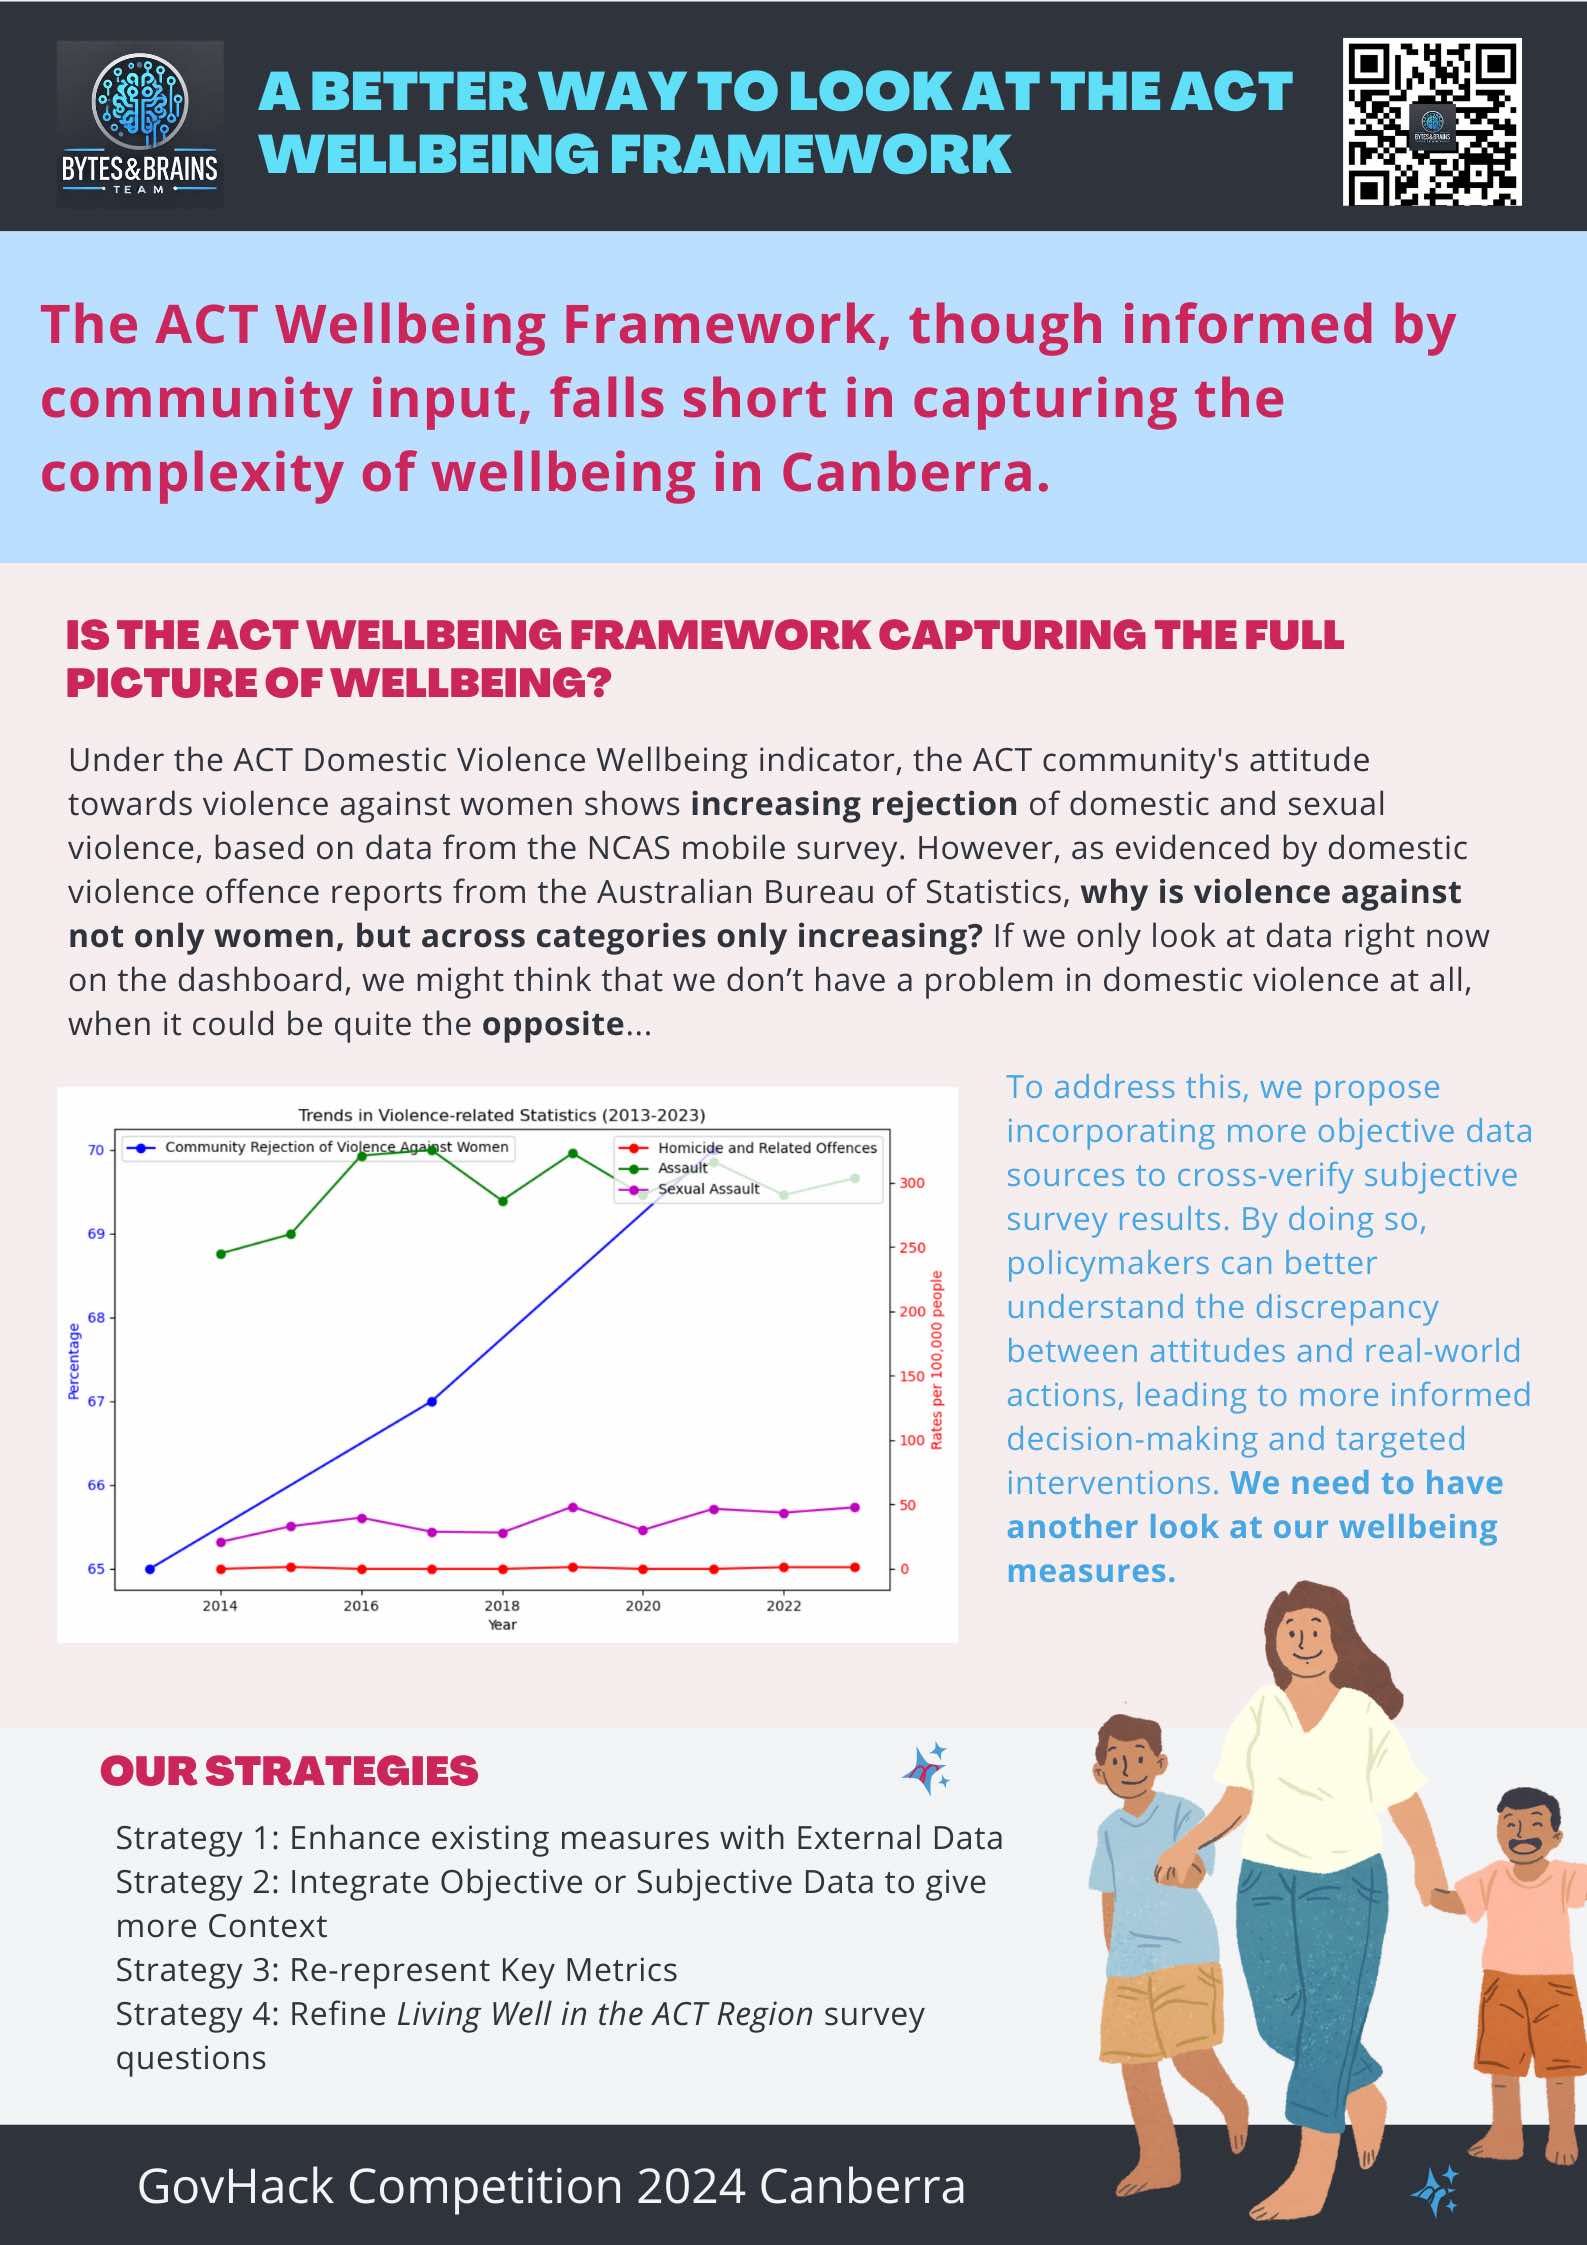
Under the ACT Domestic Violence Wellbeing indicator, the ACT community's attitude towards violence against women shows increasing rejection of domestic and sexual violence, based on data from the NCAS mobile survey. However, as evidenced by domestic violence offence reports from the Australian Bureau of Statistics, why is violence against not only women, but across categories only increasing? If we only look at data right now on the dashboard, we might think that we don't have a problem in domestic violence at all, when it could be quite the opposite...
The current ACT Wellbeing Framework, primarily informed by the Living Well in the ACT Region survey, often uses data sources and visualisations that do not fully capture the complexity and diversity of wellbeing in Canberra. As a result, key wellbeing indicators are often incomplete or misleading, offering limited insights for policymakers. When the data doesn't quite match up with the actual experiences of Canberrans, it can lead to a less complete or oversimplified picture of the region's wellbeing. This makes it harder to make the best decisions and allocate resources where they’re truly needed.
Our Solution
Our solution is a proposal that establishes a holistic framework to improve the relevance, context quality, and representativeness of the data used in the ACT Wellbeing Framework. This involves enhancing current data points with additional external sources—both subjective and objective—revising survey questions, and adjusting how data is presented on the wellbeing dashboard. By providing a fuller, more accurate picture of the real-life experiences of Canberrans, this framework will enable better-informed, evidence-based policymaking. Ultimately, the project aims to increase transparency, improve service delivery, and lead to more targeted interventions that address the actual needs of the community, resulting in a higher quality of life across the ACT region.
We present this framework briefly in our poster:
We dive deeper into each individual wellbeing indicator and provide analysis and recommendations in our comprehensive report:
Community Feedback Form
We also include a sample community feedback webpage for the dashboard.
Motivation: A simple community feedback form is essential for capturing real-time, actionable insights from residents about their experiences and perceptions of wellbeing. This direct input allows the wellbeing dashboard to remain responsive and relevant to the evolving needs of the community, ensuring that the data and indicators accurately reflect the lived experiences of Canberrans.
Usefulness: By integrating a feedback form, the wellbeing dashboard can gather valuable opinions on the effectiveness of current indicators, highlight areas for improvement, and identify emerging issues that may not be captured by existing data sources. This iterative feedback loop enhances the dashboard's accuracy and relevance, supports more informed policymaking, and fosters greater community engagement and trust in the decision-making process.
For the feedback form, proof of work, and other project details, please see our github repository
Data Story
In the heart of Canberra, the ACT Wellbeing Dashboard serves as a vital tool for understanding the quality of life across our community. However, as the needs and experiences of Canberrans evolve, the challenge remains to ensure that this dashboard reflects the true state of wellbeing. To address this, a new initiative is underway to incorporate a simple yet powerful community feedback form, aiming to refine and enhance our wellbeing indicators.
Looking at the Wellbeing dashboard
While digging into the wellbeing dashboard, we felt that its structure and domains were a comprehensive and good representation of many facets of wellbeing, however after digging deeper, we realised that for some indicators, the actual data presented graphically on the dashboard failed to fully represent the context of that wellbeing indicator and could often be misleading, leaving out important issues and populations of concern.
This discrepancy highlights a critical gap: while the dashboard provides a broad overview, it sometimes overlooks the nuanced realities of certain wellbeing indicators. Important details, such as specific community needs or emerging trends, may be missing, leading to incomplete or skewed insights. Addressing these issues requires a more detailed and contextually aware approach to data presentation. By refining the dashboard to better reflect the complexities of each indicator and incorporating feedback from diverse populations, we can enhance its accuracy and relevance. This will ensure that the dashboard not only provides a comprehensive view of wellbeing but also effectively informs policy decisions and community support efforts.
Thus, we developed our framework: Relevance, Context Quality, and Representativeness.
Using the Framework
Using the framework, we analysed the data represented under each wellbeing indicator and attempted to patch the gaps case by case using alternate internal ACT Government resources or external Australian studies, our final analysis and recommendations covered in our report.
Our report includes not only external dataset recommendations, but additionally we propose some new and enhanced survey questions that may be either used to improve the Living Well in the ACT Region survey or added to a new survey to fill these context gaps and provide a more inclusive, unbiased, and complete view of wellbeing in Canberra.
Final Thoughts
Our overall proposal is to provide a helpful framework to help the ACT take a critical lens into the ACT Wellbeing Framework dashboard to identify information gaps, misleading data, and irrelevant data to improve the helpfulness and comprehensiveness of the dashboard in order to build towards a platform that policymakers have confidence in and can inform their decision making. There is still a lot more to be completed, and we recognise the limitations of our analysis and of the current data that we have accessible to, but our hope is that by exposing the current limitations of the dashboard, we can provide a more inclusive and faithful picture of wellbeing in the ACT to better inform progress in wellbeing across all sectors and background of people and lift their quality of life to make sure no-one is left behind.