Project Description
Insights AI
Governments and policymakers often face challenges in understanding the evolving needs of their communities, leading to inefficient resource allocation, delayed infrastructure upgrades, and slow responses to local developments.
This AI-powered platform addresses these issues by integrating multi-dimensional data, including historical population growth, current geo amenities (such as police stations, hospitals, and schools), and future forecasts for the next 10 to 20 years.
By analyzing these data points, the platform provides actionable insights and recommendations on critical infrastructure upgrades ranging from roads , agecare facilities, parks to educational facilities like schools and universities, healthcare services such as hospitals and clinics, and other essential amenities like petrol stations and train stations. It identifies optimal locations and timelines for these developments, ensuring they meet the future demands of the growing community effectively and efficiently.
This Platform also provides APIs for Real time Livability Index per location and Also Forecasts Livability Index and Corresponding SubIndices for User Selected Duration.
Problems We identified
- Accurately predicting population growth using traditional methods that rely solely on birth and death rates proves to be increasingly challenging. For governments to allocate resources effectively and enhance overall quality of life, a more holistic and data-driven approach is crucial.
- Governments and policymakers often struggle to fully understand the changing needs of their communities, which can result in inefficient resource distribution, delayed infrastructure improvements, and slow responses to local developments.
- Without accurate insights and reliable forecasts, authorities are unable to identify areas that require attention within their jurisdictions, further complicating timely interventions.
- Additionally, the general public lacks access to real-time and forecasted information about livability factors in areas where they wish to live or work, making informed decisions difficult.
Addressing these gaps is crucial to building more resilient, thriving communities.
How Insights AI solves these problems
Overall SubSytem View

Language Model
For the language model, we have chosen RAG (Retrieval-Augmented Generation), which combines retrieval of relevant information from a database with a generative model, such as GPT from openAI or T5 from Google, to produce more accurate and contextually relevant responses.
Feature Selection Library
Feature Engineering creates and selects relevant data features, in our case the government datasets, to improve a model's performance. It uses domain knowledge to enhance accuracy.
Prediction Engine
The prediction engine utilizes our feature engineering library to analyse historical and current data, allowing it to make more acurate predictions about future trends. Supervised Learning is a viable candidate for the training of this prediction engine, and Continuous Learning, which involves updating the model incrementally as new data becomes available.
Example Applications
CommunityInsights

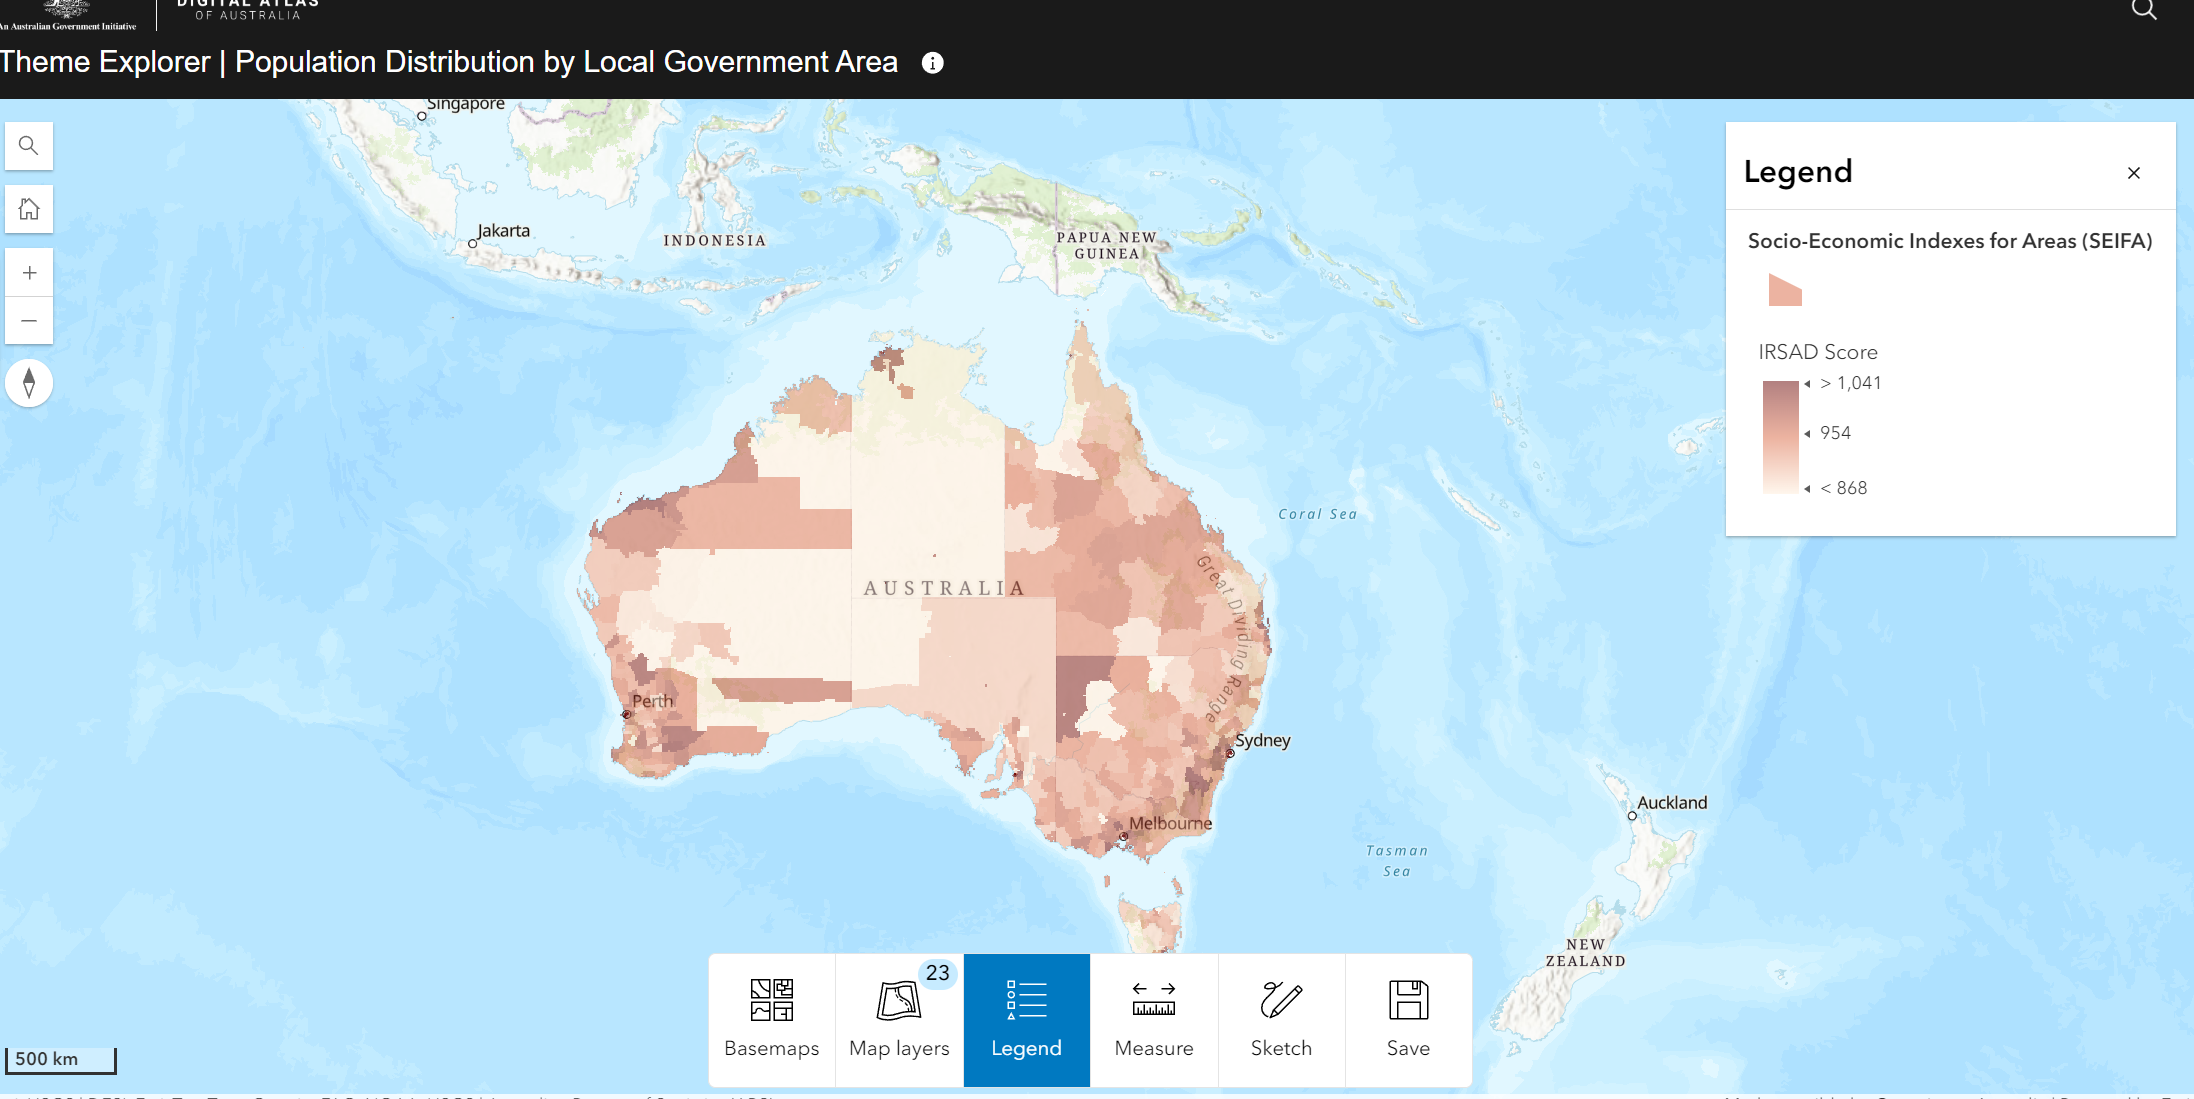
AtlasAI

Livability Index Feed to Real Estate Apps.

Insights AI APIs
GET /api/v1/liveability
- Query Params
- lga (required)
- year (required)
- categories (optional)
- unit (optional)
- Response
{
"lga": "Whitehorse",
"year": 2023,
"index": 8.7,
"categories": {
    "healthcare": 8.9,
    "education": 7.5,
    "infrastructure": 9.0
}
}
### Population Forecast
GET /api/v1/population-forecast
### Insights Api
GET /api/v1/insights/{domain}
* domain = healthcare, education, infrastructure, environment, housing
GenAi Prompt Api
POST /api/v1/generate-response
Benefits
Video Demonstration


.png?raw=true)
.png?raw=true)
.png?raw=true)
.png?raw=true)